


State House District 57, Michigan
About
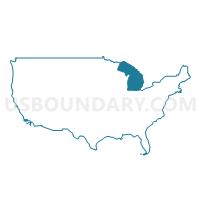
Outline

Summary
| Unique Area Identifier | 197069 |
| Name | State House District 57 |
| State | Michigan |
| Area (square miles) | 725.98 |
| Land Area (square miles) | 717.71 |
| Water Area (square miles) | 8.27 |
| % of Land Area | 98.86 |
| % of Water Area | 1.14 |
| Latitude of the Internal Point | 41.88780390 |
| Longtitude of the Internal Point | -84.06547080 |
| Total Population | 94,159 |
| Total Housing Units | 40,234 |
| Total Households | 35,227 |
| Median Age | 39.7 |
Maps

Graphs
Select a template below for downloading or customizing gragh for State House District 57, Michigan


Neighbors
Neighoring State Legislative District Lower Chamber (by Name) Neighboring State Legislative District Lower Chamber on the Map
- State House District 46, OH
- State House District 52, MI
- State House District 55, MI
- State House District 58, MI
- State House District 65, MI
- State House District 74, OH
Top 10 Neighboring County (by Population) Neighboring County on the Map
- Lucas County, OH (441,815)
- Washtenaw County, MI (344,791)
- Jackson County, MI (160,248)
- Monroe County, MI (152,021)
- Lenawee County, MI (99,892)
- Hillsdale County, MI (46,688)
- Fulton County, OH (42,698)
Top 10 Neighboring County Subdivision (by Population) Neighboring County Subdivision on the Map
- Sylvania township, Lucas County, OH (48,487)
- Adrian city, Lenawee County, MI (21,133)
- York charter township, Washtenaw County, MI (8,708)
- Madison charter township, Lenawee County, MI (8,621)
- Tecumseh city, Lenawee County, MI (8,521)
- Raisin township, Lenawee County, MI (7,559)
- Columbia township, Jackson County, MI (7,420)
- Dundee township, Monroe County, MI (6,759)
- Adrian township, Lenawee County, MI (6,035)
- Cambridge township, Lenawee County, MI (5,733)
Top 10 Neighboring Place (by Population) Neighboring Place on the Map
- Adrian city, MI (21,133)
- Tecumseh city, MI (8,521)
- Blissfield village, MI (3,340)
- Clinton village, MI (2,336)
- Hudson city, MI (2,307)
- Morenci city, MI (2,220)
- Manitou Beach-Devils Lake CDP, MI (2,019)
- Deerfield village, MI (898)
- Addison village, MI (605)
- Britton village, MI (586)
Top 10 Neighboring Unified School District (by Population) Neighboring Unified School District on the Map
- Sylvania City School District, OH (52,612)
- Adrian City School District, MI (29,421)
- Saline Area Schools, MI (26,376)
- Tecumseh Public Schools, MI (18,292)
- Milan Area Schools, MI (14,409)
- Columbia School District, MI (11,469)
- Onsted Community Schools, MI (9,400)
- Dundee Community Schools, MI (8,731)
- Addison Community Schools, MI (8,084)
- Madison School District, MI (7,908)
Top 10 Neighboring State Legislative District Upper Chamber (by Population) Neighboring State Legislative District Upper Chamber on the Map
- State Senate District 2, OH (363,296)
- State Senate District 1, OH (351,303)
- State Senate District 17, MI (267,269)
- State Senate District 16, MI (253,123)
- State Senate District 19, MI (251,432)
Top 10 Neighboring 111th Congressional District (by Population) Neighboring 111th Congressional District on the Map
- Congressional District 15, MI (682,205)
- Congressional District 7, MI (676,899)
- Congressional District 5, OH (627,799)
- Congressional District 9, OH (619,010)
Top 10 Neighboring Census Tract (by Population) Neighboring Census Tract on the Map
- Census Tract 617, Lenawee County, MI (9,776)
- Census Tract 92.01, Lucas County, OH (7,860)
- Census Tract 607, Lenawee County, MI (7,083)
- Census Tract 4222, Washtenaw County, MI (7,015)
- Census Tract 8308, Monroe County, MI (6,759)
- Census Tract 615, Lenawee County, MI (5,742)
- Census Tract 606, Lenawee County, MI (5,385)
- Census Tract 623, Lenawee County, MI (5,301)
- Census Tract 624, Lenawee County, MI (5,055)
- Census Tract 408, Fulton County, OH (4,940)
Top 10 Neighboring 5-Digit ZIP Code Tabulation Area (by Population) Neighboring 5-Digit ZIP Code Tabulation Area on the Map
- 49221, MI (41,310)
- 43560, OH (32,226)
- 48176, MI (21,447)
- 49286, MI (14,797)
- 48160, MI (13,785)
- 49230, MI (10,475)
- 48158, MI (7,309)
- 49270, MI (5,874)
- 49247, MI (5,768)
- 49228, MI (5,545)
Data
Demographic, Population, Households, and Housing Units
** Data sources from census 2010 **
Show Data on Map
Download Full List as CSV
Download Quick Sheet as CSV
| Subject | This Area | Michigan | National |
|---|---|---|---|
| POPULATION | |||
| Total Population Map | 94,159 | 9,883,640 | 308,745,538 |
| POPULATION, HISPANIC OR LATINO ORIGIN | |||
| Not Hispanic or Latino Map | 86,693 | 9,447,282 | 258,267,944 |
| Hispanic or Latino Map | 7,466 | 436,358 | 50,477,594 |
| POPULATION, RACE | |||
| White alone Map | 86,619 | 7,803,120 | 223,553,265 |
| Black or African American alone Map | 2,518 | 1,400,362 | 38,929,319 |
| American Indian and Alaska Native alone Map | 447 | 62,007 | 2,932,248 |
| Asian alone Map | 496 | 238,199 | 14,674,252 |
| Native Hawaiian and Other Pacific Islander alone Map | 20 | 2,604 | 540,013 |
| Some Other Race alone Map | 1,938 | 147,029 | 19,107,368 |
| Two or More Races Map | 2,121 | 230,319 | 9,009,073 |
| POPULATION, SEX | |||
| Male Map | 47,585 | 4,848,114 | 151,781,326 |
| Female Map | 46,574 | 5,035,526 | 156,964,212 |
| POPULATION, AGE (18 YEARS) | |||
| 18 years and over Map | 72,314 | 7,539,572 | 234,564,071 |
| Under 18 years | 21,845 | 2,344,068 | 74,181,467 |
| POPULATION, AGE | |||
| Under 5 years | 5,430 | 596,286 | 20,201,362 |
| 5 to 9 years | 5,899 | 637,784 | 20,348,657 |
| 10 to 14 years | 6,379 | 675,216 | 20,677,194 |
| 15 to 17 years | 4,137 | 434,782 | 12,954,254 |
| 18 and 19 years | 3,100 | 304,817 | 9,086,089 |
| 20 years | 1,469 | 149,350 | 4,519,129 |
| 21 years | 1,294 | 138,484 | 4,354,294 |
| 22 to 24 years | 3,225 | 381,238 | 12,712,576 |
| 25 to 29 years | 5,170 | 589,583 | 21,101,849 |
| 30 to 34 years | 5,423 | 574,566 | 19,962,099 |
| 35 to 39 years | 5,927 | 612,493 | 20,179,642 |
| 40 to 44 years | 6,339 | 665,481 | 20,890,964 |
| 45 to 49 years | 7,037 | 744,581 | 22,708,591 |
| 50 to 54 years | 7,216 | 765,452 | 22,298,125 |
| 55 to 59 years | 6,683 | 683,186 | 19,664,805 |
| 60 and 61 years | 2,470 | 243,067 | 7,113,727 |
| 62 to 64 years | 3,306 | 325,744 | 9,704,197 |
| 65 and 66 years | 1,806 | 177,313 | 5,319,902 |
| 67 to 69 years | 2,433 | 241,312 | 7,115,361 |
| 70 to 74 years | 3,005 | 306,084 | 9,278,166 |
| 75 to 79 years | 2,447 | 244,085 | 7,317,795 |
| 80 to 84 years | 2,055 | 200,855 | 5,743,327 |
| 85 years and over | 1,909 | 191,881 | 5,493,433 |
| MEDIAN AGE BY SEX | |||
| Both sexes Map | 39.70 | 38.90 | 37.20 |
| Male Map | 38.20 | 37.60 | 35.80 |
| Female Map | 41.30 | 40.00 | 38.50 |
| HOUSEHOLDS | |||
| Total Households Map | 35,227 | 3,872,508 | 116,716,292 |
| HOUSEHOLDS, HOUSEHOLD TYPE | |||
| Family households: Map | 24,557 | 2,554,073 | 77,538,296 |
| Husband-wife family Map | 19,057 | 1,857,127 | 56,510,377 |
| Other family: Map | 5,500 | 696,946 | 21,027,919 |
| Male householder, no wife present Map | 1,616 | 185,363 | 5,777,570 |
| Female householder, no husband present Map | 3,884 | 511,583 | 15,250,349 |
| Nonfamily households: Map | 10,670 | 1,318,435 | 39,177,996 |
| Householder living alone Map | 8,897 | 1,079,678 | 31,204,909 |
| Householder not living alone Map | 1,773 | 238,757 | 7,973,087 |
| HOUSEHOLDS, HISPANIC OR LATINO ORIGIN OF HOUSEHOLDER | |||
| Not Hispanic or Latino householder: Map | 33,199 | 3,757,825 | 103,254,926 |
| Hispanic or Latino householder: Map | 2,028 | 114,683 | 13,461,366 |
| HOUSEHOLDS, RACE OF HOUSEHOLDER | |||
| Householder who is White alone | 33,520 | 3,158,462 | 89,754,352 |
| Householder who is Black or African American alone | 378 | 523,980 | 14,129,983 |
| Householder who is American Indian and Alaska Native alone | 158 | 22,676 | 939,707 |
| Householder who is Asian alone | 143 | 74,263 | 4,632,164 |
| Householder who is Native Hawaiian and Other Pacific Islander alone | 5 | 860 | 143,932 |
| Householder who is Some Other Race alone | 605 | 39,917 | 4,916,427 |
| Householder who is Two or More Races | 418 | 52,350 | 2,199,727 |
| HOUSEHOLDS, HOUSEHOLD TYPE BY HOUSEHOLD SIZE | |||
| Family households: Map | 24,557 | 2,554,073 | 77,538,296 |
| 2-person household Map | 11,187 | 1,116,122 | 31,882,616 |
| 3-person household Map | 5,416 | 575,906 | 17,765,829 |
| 4-person household Map | 4,567 | 490,745 | 15,214,075 |
| 5-person household Map | 2,145 | 230,373 | 7,411,997 |
| 6-person household Map | 777 | 87,344 | 3,026,278 |
| 7-or-more-person household Map | 465 | 53,583 | 2,237,501 |
| Nonfamily households: Map | 10,670 | 1,318,435 | 39,177,996 |
| 1-person household Map | 8,897 | 1,079,678 | 31,204,909 |
| 2-person household Map | 1,474 | 191,327 | 6,360,012 |
| 3-person household Map | 178 | 27,576 | 992,156 |
| 4-person household Map | 81 | 13,570 | 411,171 |
| 5-person household Map | 25 | 3,701 | 126,634 |
| 6-person household Map | 10 | 1,628 | 48,421 |
| 7-or-more-person household Map | 5 | 955 | 34,693 |
| HOUSING UNITS | |||
| Total Housing Units Map | 40,234 | 4,532,233 | 131,704,730 |
| HOUSING UNITS, OCCUPANCY STATUS | |||
| Occupied Map | 35,227 | 3,872,508 | 116,716,292 |
| Vacant Map | 5,007 | 659,725 | 14,988,438 |
| HOUSING UNITS, OCCUPIED, TENURE | |||
| Owned with a mortgage or a loan Map | 18,913 | 1,920,245 | 52,979,430 |
| Owned free and clear Map | 8,139 | 873,097 | 23,006,644 |
| Renter occupied Map | 8,175 | 1,079,166 | 40,730,218 |
| HOUSING UNITS, VACANT, VACANCY STATUS | |||
| For rent Map | 1,124 | 141,687 | 4,137,567 |
| Rented, not occupied Map | 33 | 6,684 | 206,825 |
| For sale only Map | 757 | 77,080 | 1,896,796 |
| Sold, not occupied Map | 187 | 17,978 | 421,032 |
| For seasonal, recreational, or occasional use Map | 1,619 | 263,071 | 4,649,298 |
| For migrant workers Map | 8 | 1,773 | 24,161 |
| Other vacant Map | 1,279 | 151,452 | 3,652,759 |
| HOUSING UNITS, OCCUPIED, AVERAGE HOUSEHOLD SIZE BY TENURE | |||
| Total: Map | 2.52 | 2.49 | 2.58 |
| Owner occupied Map | 2.57 | 2.57 | 2.65 |
| Renter occupied Map | 2.36 | 2.29 | 2.44 |
| HOUSING UNITS, OCCUPIED, TENURE BY RACE OF HOUSEHOLDER | |||
| Owner occupied: Map | 27,052 | 2,793,342 | 75,986,074 |
| Householder who is White alone Map | 26,116 | 2,452,233 | 63,446,275 |
| Householder who is Black or African American alone Map | 159 | 235,381 | 6,261,464 |
| Householder who is American Indian and Alaska Native alone Map | 98 | 13,611 | 509,588 |
| Householder who is Asian alone Map | 98 | 43,419 | 2,688,861 |
| Householder who is Native Hawaiian and Other Pacific Islander alone Map | 4 | 466 | 61,911 |
| Householder who is Some Other Race alone Map | 325 | 20,361 | 1,975,817 |
| Householder who is Two or More Races Map | 252 | 27,871 | 1,042,158 |
| Renter occupied: Map | 8,175 | 1,079,166 | 40,730,218 |
| Householder who is White alone Map | 7,404 | 706,229 | 26,308,077 |
| Householder who is Black or African American alone Map | 219 | 288,599 | 7,868,519 |
| Householder who is American Indian and Alaska Native alone Map | 60 | 9,065 | 430,119 |
| Householder who is Asian alone Map | 45 | 30,844 | 1,943,303 |
| Householder who is Native Hawaiian and Other Pacific Islander alone Map | 1 | 394 | 82,021 |
| Householder who is Some Other Race alone Map | 280 | 19,556 | 2,940,610 |
| Householder who is Two or More Races Map | 166 | 24,479 | 1,157,569 |
| HOUSING UNITS, OCCUPIED, TENURE BY HISPANIC OR LATINO ORIGIN OF HOUSEHOLDER | |||
| Owner occupied: Map | 27,052 | 2,793,342 | 75,986,074 |
| Not Hispanic or Latino householder Map | 25,871 | 2,728,916 | 69,617,625 |
| Hispanic or Latino householder Map | 1,181 | 64,426 | 6,368,449 |
| Renter occupied: Map | 8,175 | 1,079,166 | 40,730,218 |
| Not Hispanic or Latino householder Map | 7,328 | 1,028,909 | 33,637,301 |
| Hispanic or Latino householder Map | 847 | 50,257 | 7,092,917 |
| HOUSING UNITS, OCCUPIED, TENURE BY HOUSEHOLD SIZE | |||
| Owner occupied: Map | 27,052 | 2,793,342 | 75,986,074 |
| 1-person household Map | 5,776 | 643,556 | 16,453,569 |
| 2-person household Map | 10,617 | 1,031,004 | 27,618,605 |
| 3-person household Map | 4,319 | 446,449 | 12,517,563 |
| 4-person household Map | 3,710 | 392,843 | 10,998,793 |
| 5-person household Map | 1,666 | 177,918 | 5,057,765 |
| 6-person household Map | 625 | 64,470 | 1,965,796 |
| 7-or-more-person household Map | 339 | 37,102 | 1,373,983 |
| Renter occupied: Map | 8,175 | 1,079,166 | 40,730,218 |
| 1-person household Map | 3,121 | 436,122 | 14,751,340 |
| 2-person household Map | 2,044 | 276,445 | 10,624,023 |
| 3-person household Map | 1,275 | 157,033 | 6,240,422 |
| 4-person household Map | 938 | 111,472 | 4,626,453 |
| 5-person household Map | 504 | 56,156 | 2,480,866 |
| 6-person household Map | 162 | 24,502 | 1,108,903 |
| 7-or-more-person household Map | 131 | 17,436 | 898,211 |
Loading...